A cartogram is a map produced using a cartographic technique where the mapped polygons (e.g., county or state boundaries) are stretched or shrunk based on the magnitude of the variable being mapped. This distortion of area can make odd-looking but more representative maps.
One great example of cartograms is from Mark Newman of the University of Michigan. His presidential election maps put a new twist on the “red state vs blue state” maps that have been a staple of TV news election coverage since 2000.

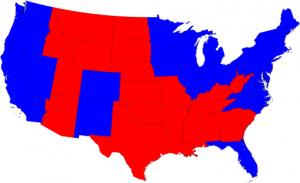
Map of states carried by Obama (blue) and McCain (red) in the 2008 Presidential Election. source: http://www-personal.umich.edu/~mejn/election/2008/
The above map shows whether the majority of voters chose the Republican candidate (in red) or the Democratic candidate (in blue) in the 2008 Presidential election. The size of the mapping units – the states – do not indicate the underlying population, however, and a larger area of the map appears red.
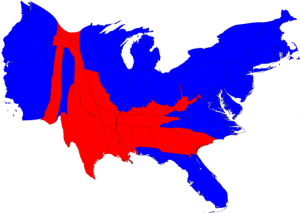
In the map below, the size of each state is altered based on its population. The less populous western states (the Dakotas, Wyoming, Montana…) are reduced in size, while the more densely populated states are increased. Though the shapes of some states are warped significantly, most are still recognizable, and the map gives a more accurate picture of the election results.

Cartogram of 2008 election results, with state size modified by population. source: http://www-personal.umich.edu/~mejn/election/2008/
All maps are produced using a series of compromises (map scale, data generalization, color choice…) and statewide election maps do not tell the whole story. Dr Newman has county-based election results maps on his web site that show more details – I encourage you to explore them. He even makes the software for producing them available for free. See also this post from ESRI that discusses cartograms, with a link to an ArcGIS tool for producing cartograms.
To see some cartograms for other areas of the world, visit Worldmapper
I have one final comment on the “red states vs blue states” maps. Having grown up during the Cold War, I find it very bizarre that red has become associated with the Republican Party. “Red” was connected to Communism: the U.S.S.R., China, and the general Communist threat. On the Mercator Projection map of the world (which greatly inflates the size of high-latitude countries, such as the USSR) that hung on my grade school wall, Communist countries were colored red. Not the color I would ever expect the GOP to embrace. Times change, I guess…
