I. Finding and downloading (recent) CIR imagery
If you need color infrared (false-color) photos for vegetation analysis, you may find these instructions useful. Many sites (e.g., the USDA Geo Gateway) strip the near-IR band from recent imagery to keep file sizes small. Fortunately, the complete, four-band images are available from the National Map web site. Keep reading to learn how to find and use CIR imagery.
1) Go to http://nationalmap.gov/viewer.html
2) Click on  or visit http://viewer.nationalmap.gov/viewer/
3) Zoom in on your area of interest using either the scroll wheel on your mouse or the zoom tool ![]() at the top of the map window
at the top of the map window
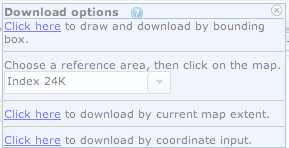
4) Click the Download Data button ![]() You will be asked if you wish to define a download area by drawing a box, by using 1:24k quad sheets, by using the entire visible map, or by entering coordinates. Choose the first option (bounding box). Click and drag over your area of interest (AOI).
You will be asked if you wish to define a download area by drawing a box, by using 1:24k quad sheets, by using the entire visible map, or by entering coordinates. Choose the first option (bounding box). Click and drag over your area of interest (AOI).
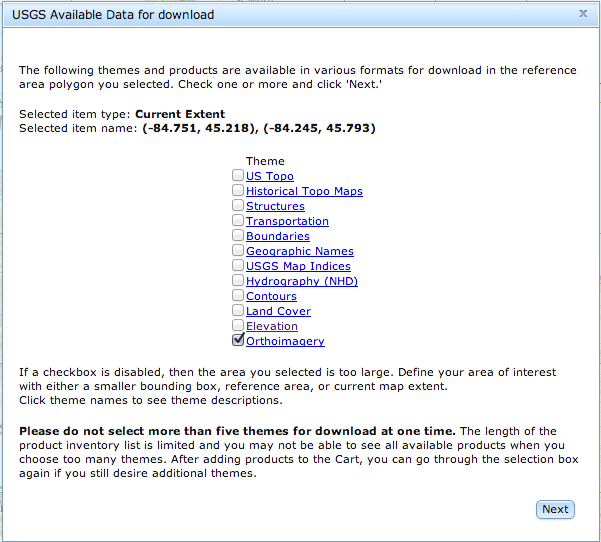
5) Next, you are presented with list of available data for your AOI. Choose Orthoimagery and click Next.
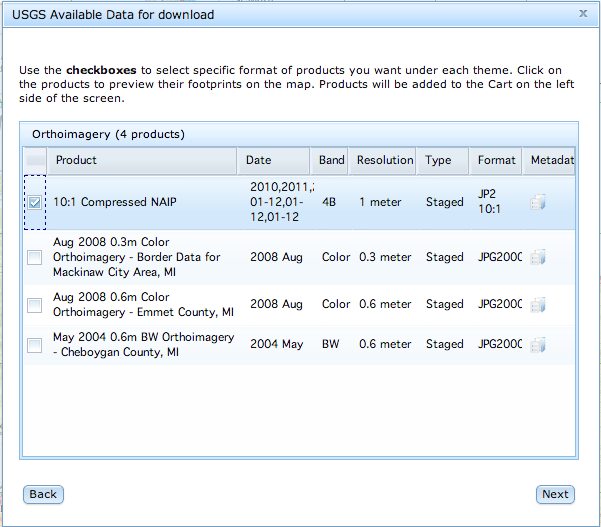
6) You will be shown a list of imagery available for your AOI. The first option, 10:1 Compressed NAIP, contains the 2010-2012 4-band imagery. (Note under “Band” these data are listed as 4B (red, green, blue, and near-infrared)). Check the box next to 10:1Compressed NAIP, then click Next.
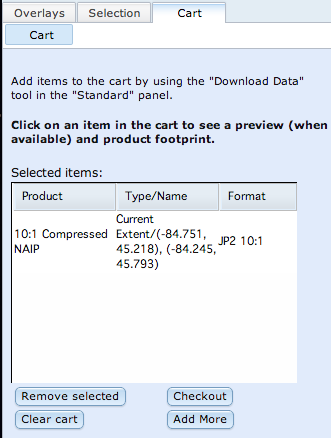
7) Your ‘shopping cart’ will appear on the left side of your browser window. Click the Checkout button.
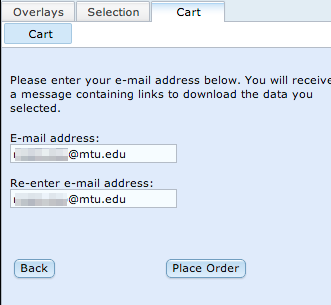
8) Enter your email address twice on the next screen and click Place Order.
9) You should see a confirmation of your order in a pop-up window. Click OK to dismiss the pop-up.
You will receive an e-mail message with links to your download. Note that orthophotos are distributed in 3.75-minute tiles, so each 7.5-minute (1:24,000 scale USGS quagrangle map) will be covered by four photos. A county may require several dozen images for complete coverage.
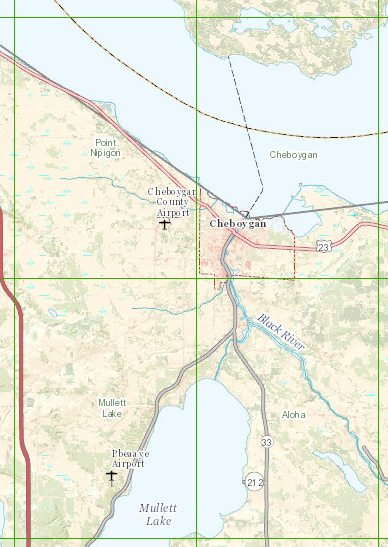
Four USGS 7.5-minute quads are shown in the image above (Point Nipigon, Cheboygan, Aloha, and Mullett Lake). Sixteen images would need to be downloaded to cover this ~18 x ~12-mile area.
II. Displaying Color infrared (CIR) Imagery in ArcGIS
1) After downloading your images, start ArcMap and open a new map document.
2) Use the ArcCatalog tab or the Add Data tool to browse to your data folder. Add the downloaded images to your map. By default, ArcGIS will display the images using a standard, “visible color” scheme (red-green-blue).
3) Right-click on an image and choose Properties… 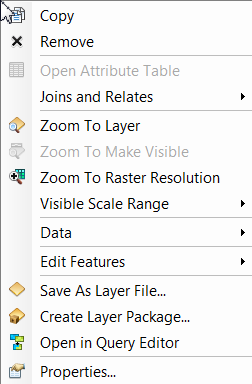
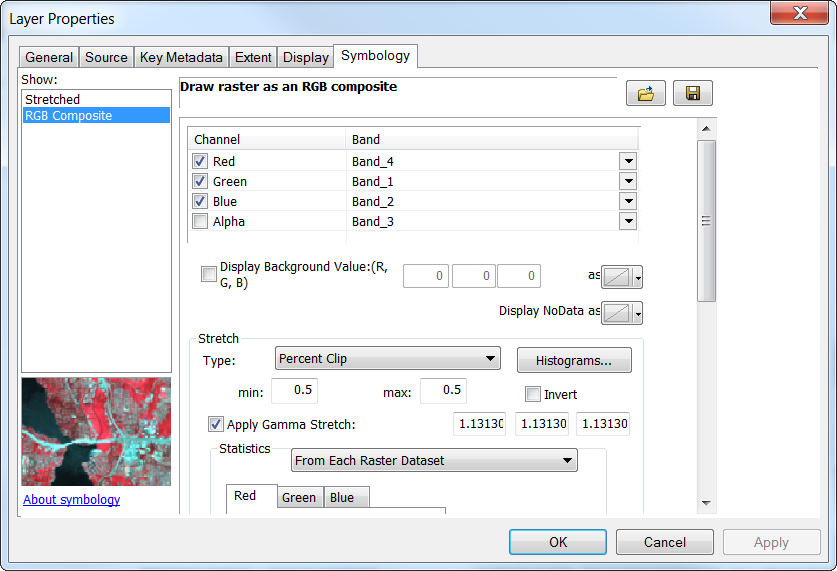
4) Choose the Symbology tab and change Red to Band_4, Green to Band_1, and Blue to Band_2. Click Apply, then OK.
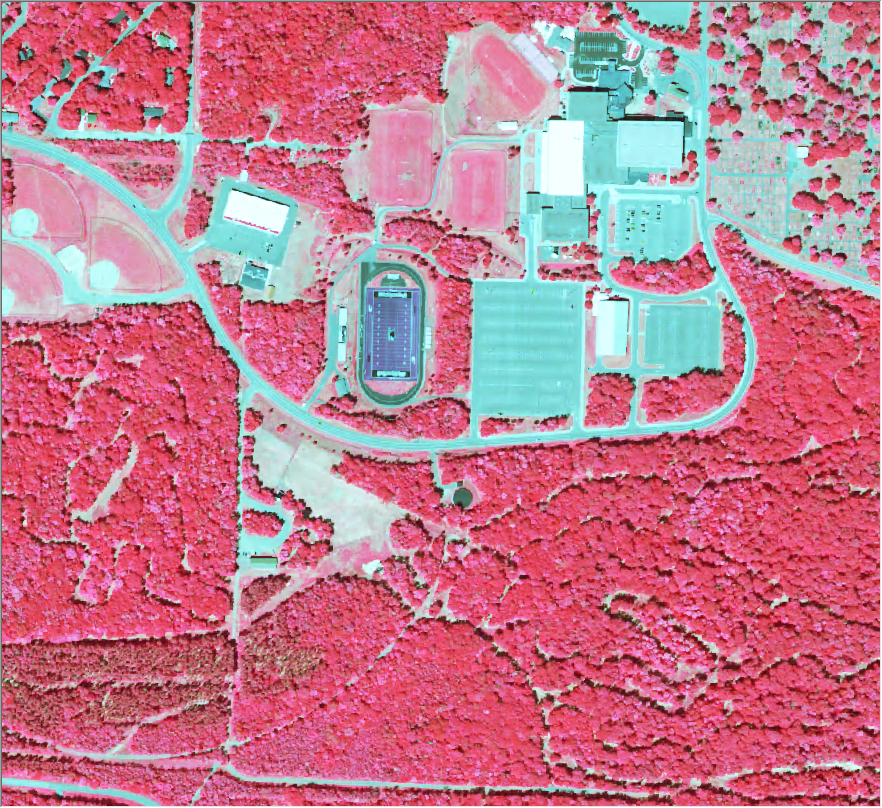
5) Your image should change from primarily green to red (assuming you are viewing a forested or otherwise vegetated area).
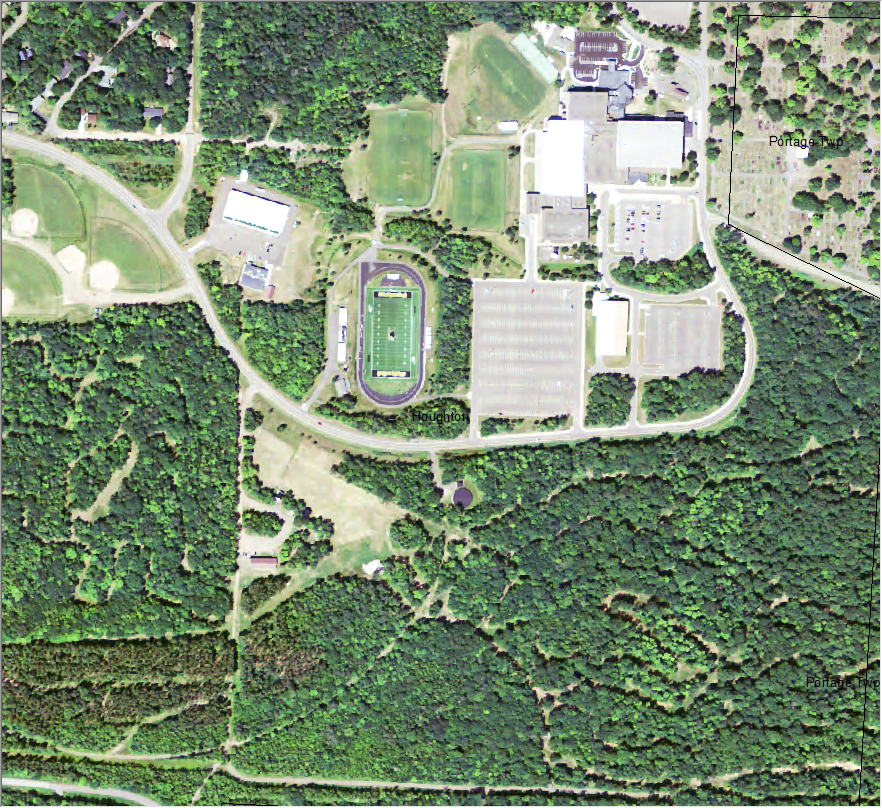
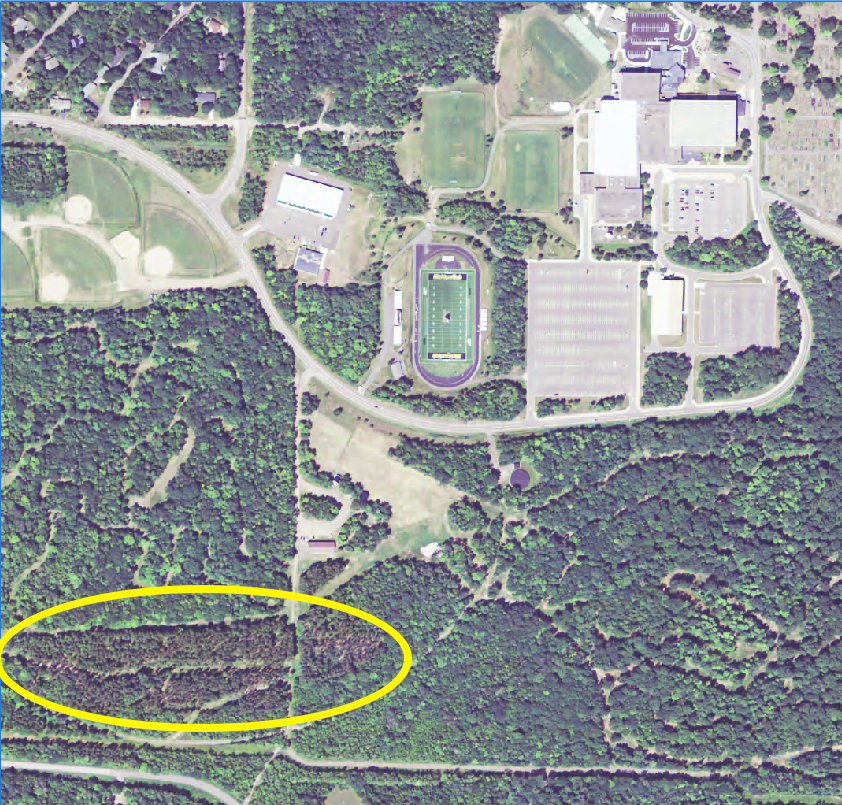
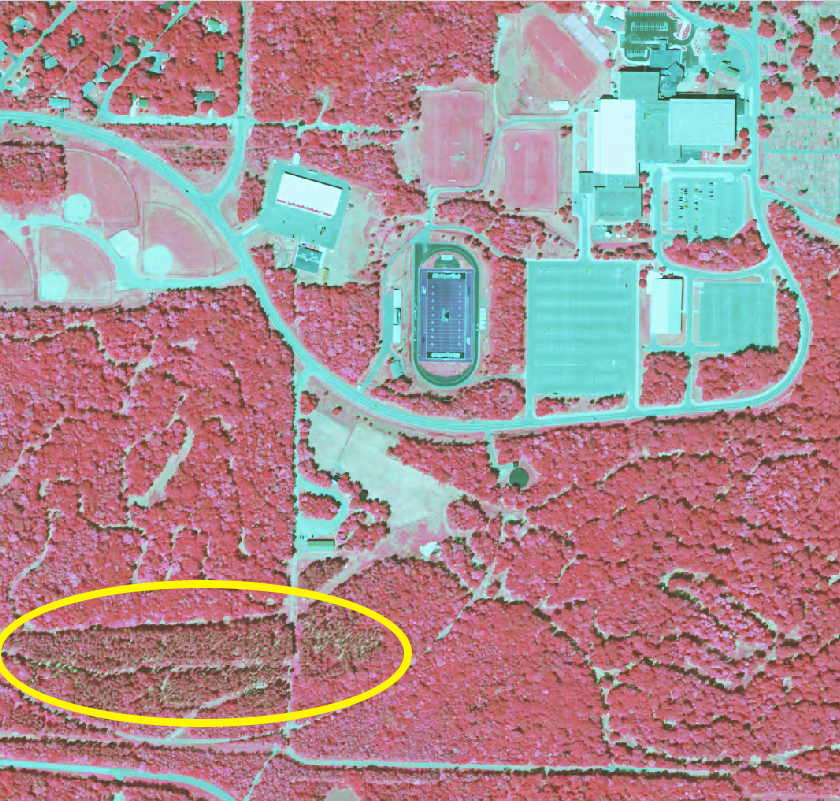
The top image above is shown in standard (R-G-B) colors; the one below in ‘false color’ NIR-R-G. Healthy, chlorophyll-rich green vegetation is depicted in reds and pinks in false color imagery. Note that Sherman Field, Michigan Tech’s football field, is artificial turf: it appears green to the naked eye (standard color image), but is nearly black on the CIR image. Infrared film was originally known as ‘camouflage detection film’ due to the ability to resolve ‘fake’ vegetation in this manner.
6) Repeat the band settings (changing to bands 4-1-2) for each image in your map.
III. Displaying Color Infrared (CIR) Imagery in QGIS
1) After downloading your images, start QGIS and open a new project document (loading a new, empty project document is the default behavior).
2) Use the Browser to view your data folder. If you don’t see the Browser, go to View > Panels and ensure that Browser is checked.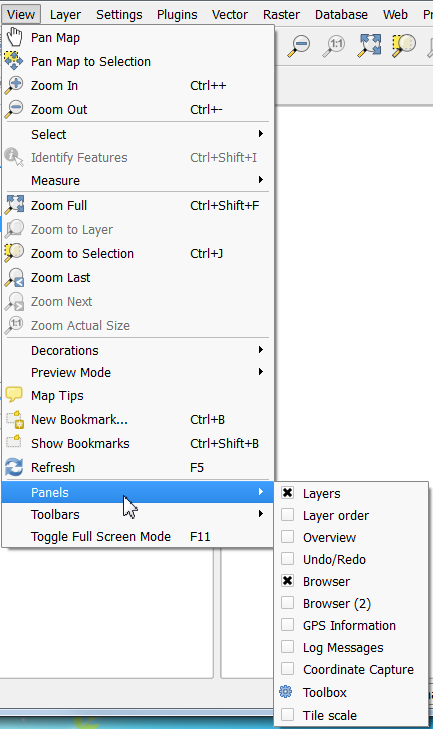
3) Next, expand the directory that contains the images you downloaded. Add any images you need by dragging them from the Browser to the map. By default, QGIS will display color imagery using a standard, “visible color” scheme (red-green-blue).
You could instead use the Add Raster Layer tool (above) to add your images but I find the Browser easier to use.
4) Right-click on an image in your Layers list and choose Properties 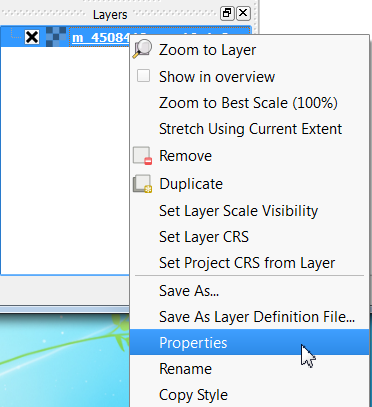
5) Select the Style panel. Set the Red band to display Band 4, the Green to Band 1, and the Blue to Band 2. Click Apply and then OK.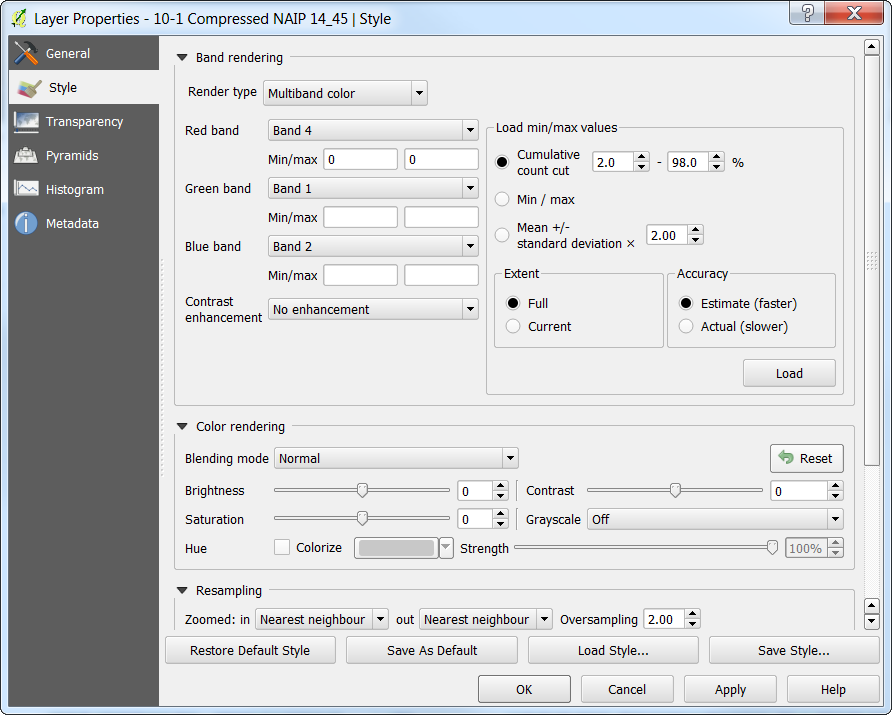
6) QGIS will now display your image in shades of red instead of green (assuming you are viewing a forested or otherwise vegetated area).
Note that conifers have different leaf cell structure and contain less chlorophyll than deciduous vegetation, so along with differences in texture (conifers often appear coarser), coniferous trees are usually darker on false-color imagery because they reflect less energy in the NIR band. A coniferous stand is highlighted in the two images above.

