Finding and displaying color infrared imagery for the U.S.

I. Finding and downloading (recent) CIR imagery

If you need color infrared (false-color) photos for vegetation analysis, you may find these instructions useful. Many sites (e.g., the USDA Geo Gateway) strip the near-IR band from recent imagery to keep file sizes small. Fortunately, the complete, four-band images are available from the National Map web site. Keep reading to learn how to find and use CIR imagery.

1) Go to http://nationalmap.gov/viewer.html

2) Click on or visit http://viewer.nationalmap.gov/viewer/

3) Zoom in on your area of interest using either the scroll wheel on your mouse or the zoom tool  at the top of the map window
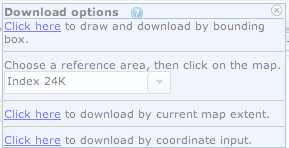
4) Click the Download Data button  You will be asked if you wish to define a download area by drawing a box, by using 1:24k quad sheets, by using the entire visible map, or by entering coordinates. Choose the first option (bounding box). Click and drag over your area of interest (AOI).

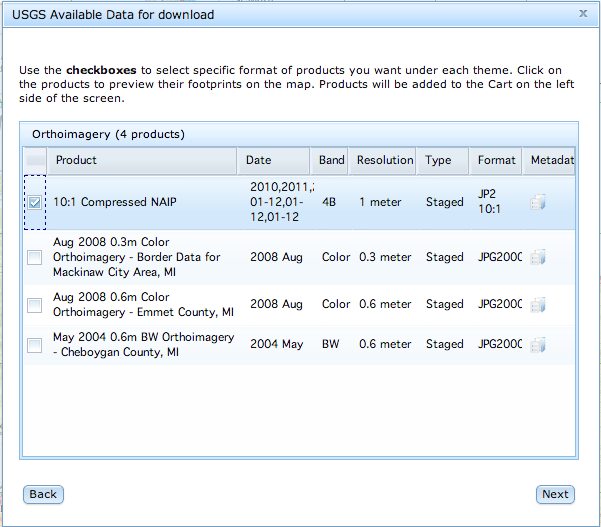
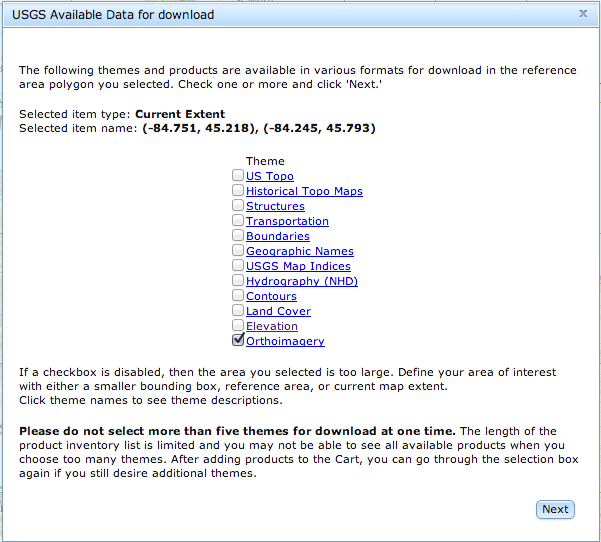
5) Next, you are presented with list of available data for your AOI. Choose Orthoimagery and click Next.

6) You will be shown a list of imagery available for your AOI. The first option, 10:1 Compressed NAIP,  contains the 2010-2012 4-band imagery. (Note under “Band” these data are listed as 4B (red, green, blue, and near-infrared)). Check the box next to 10:1Compressed NAIP, then click Next.

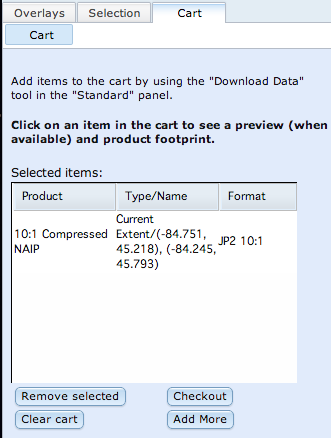
7) Your ‘shopping cart’ will appear on the left side of your browser window. Click the Checkout button.

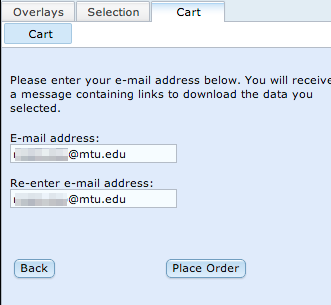
8) Enter your email address twice on the next screen and click Place Order.

9) You should see a confirmation of your order in a pop-up window. Click OK to dismiss the pop-up.

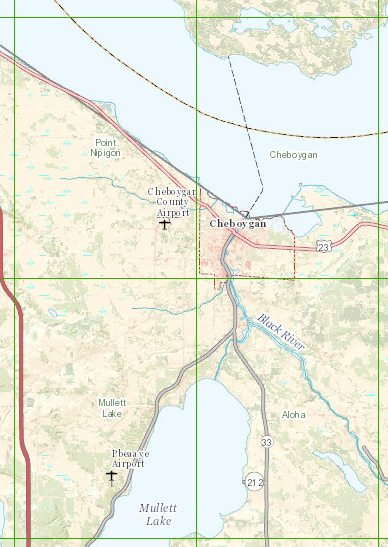
You will receive an e-mail message with links to your download. Note that orthophotos are distributed in 3.75-minute tiles, so each 7.5-minute (1:24,000 scale USGS quagrangle map) will be covered by four photos. A county may require several dozen images for complete coverage.

Four USGS 7.5-minute quads are shown in the image above (Point Nipigon, Cheboygan, Aloha, and Mullett Lake). Sixteen images would need to be downloaded to cover this ~18 x ~12-mile area.


II. Displaying Color infrared (CIR) Imagery in ArcGIS

1) After downloading your images, start ArcMap and open a new map document.

2) Use the ArcCatalog tab or the Add Data tool to browse to your data folder. Add the downloaded images to your map. By default, ArcGIS will display the images using a standard, “visible color” scheme (red-green-blue).

3) Right-click on an image and choose Properties… 
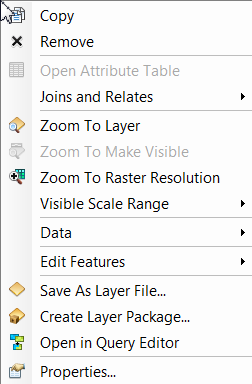
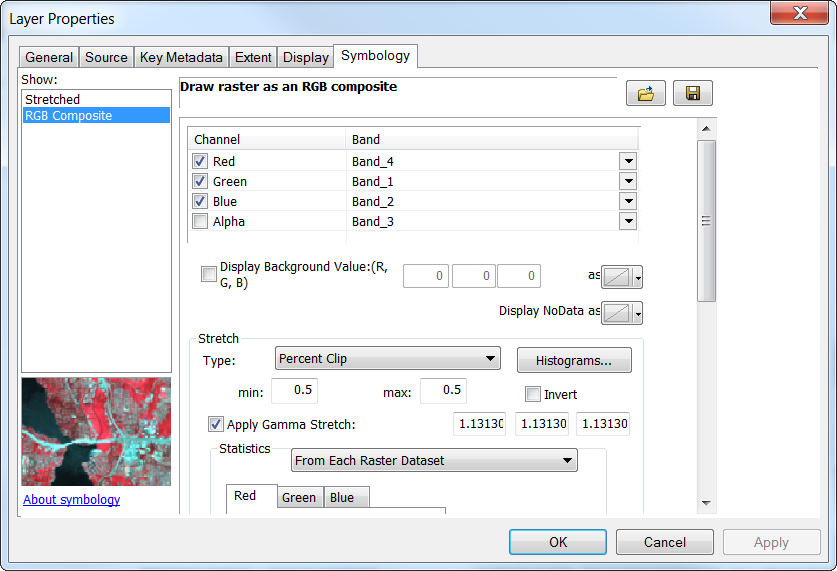
4) Choose the Symbology tab and change Red to Band_4, Green to Band_1, and Blue to Band_2. Click Apply, then OK.

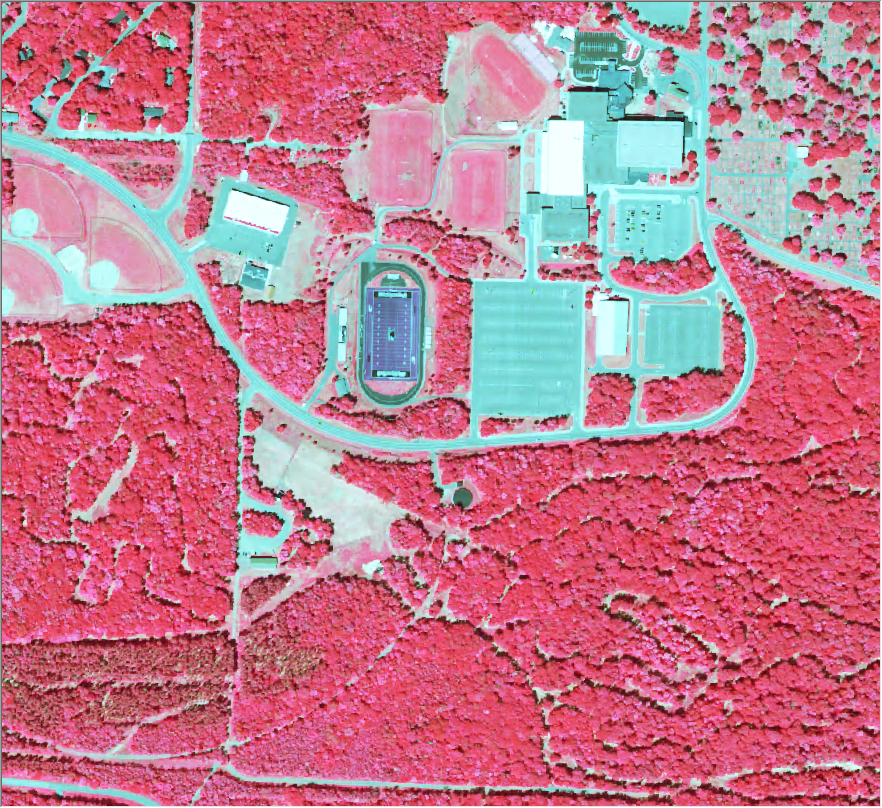
5) Your image should change from primarily green to red (assuming you are viewing a forested or otherwise vegetated area).

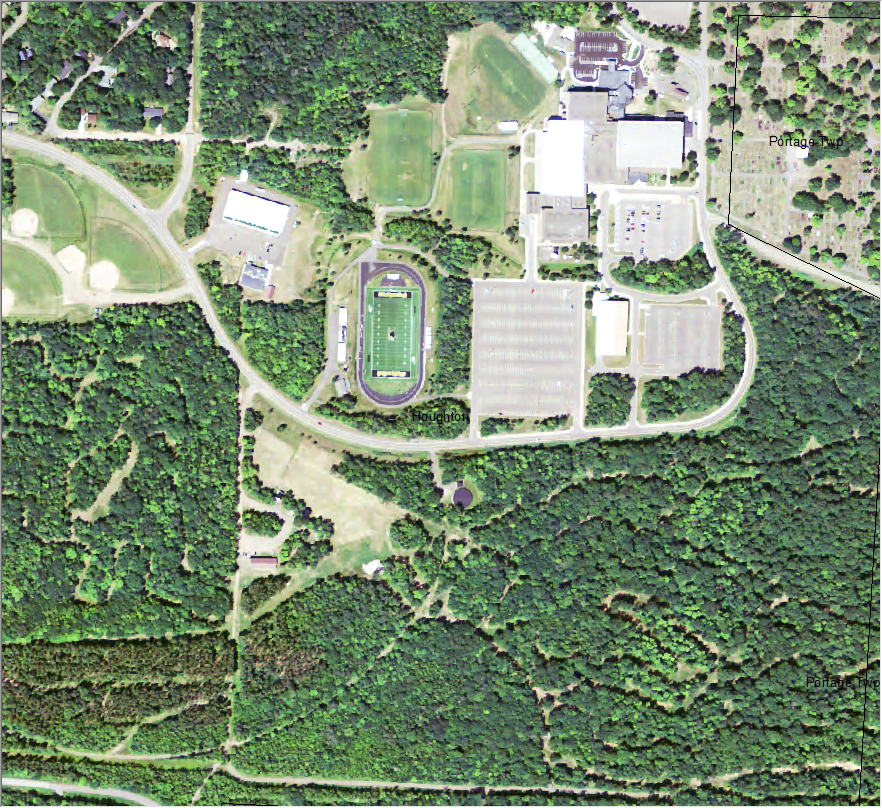
The top image above is shown in standard (R-G-B) colors; the one below in ‘false color’ NIR-R-G. Healthy, chlorophyll-rich green vegetation is depicted in reds and pinks in false color imagery. Note that Sherman Field, Michigan Tech’s football field, is artificial turf: it appears green to the naked eye (standard color image), but is nearly black on the CIR image. Infrared film was originally known as ‘camouflage detection film’ due to the ability to resolve ‘fake’ vegetation in this manner.

6) Repeat the band settings (changing to bands 4-1-2) for each image in your map.


III. Displaying Color Infrared (CIR) Imagery in QGIS

1) After downloading your images, start QGIS and open a new project document (loading a new, empty project document is the default behavior).

2) Use the Browser to view your data folder. If you don’t see the Browser, go to View > Panels and ensure that Browser is checked.
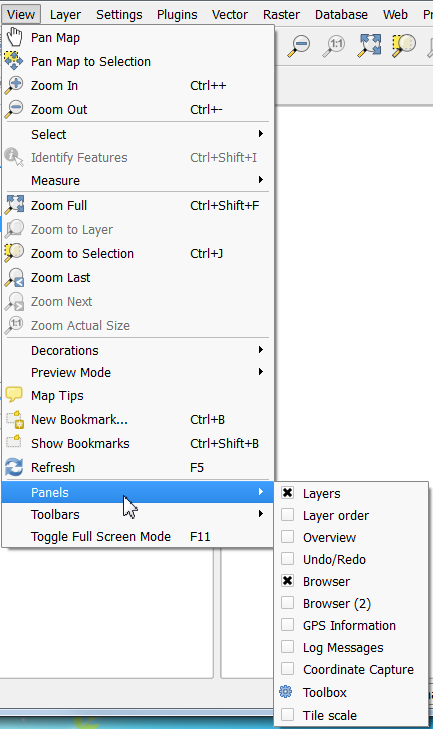
 

3) Next, expand the directory that contains the images you downloaded. Add any images you need by dragging them from the Browser to the map. By default, QGIS will display color imagery  using a standard, “visible color” scheme (red-green-blue).

You could instead use the Add Raster Layer tool (above) to add your images but I find the Browser easier to use.

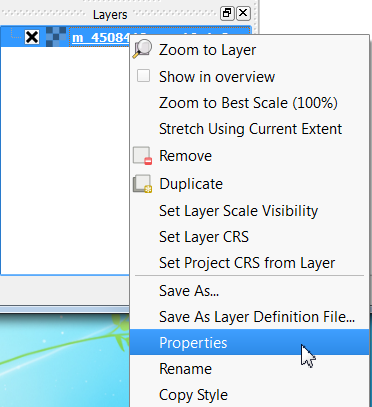
4) Right-click on an image in your Layers list and choose Properties 
5) Select the Style panel. Set the Red band to display Band 4, the Green to Band 1, and the Blue to Band 2. Click Apply and then OK.
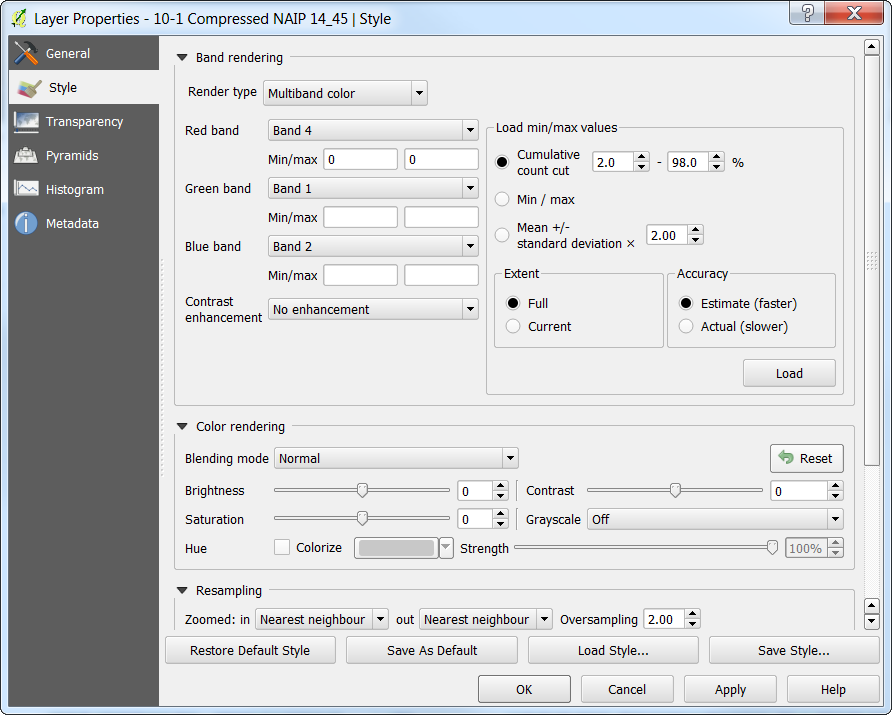
6) QGIS will now display your image in shades of red instead of green (assuming you are viewing a forested or otherwise vegetated area).

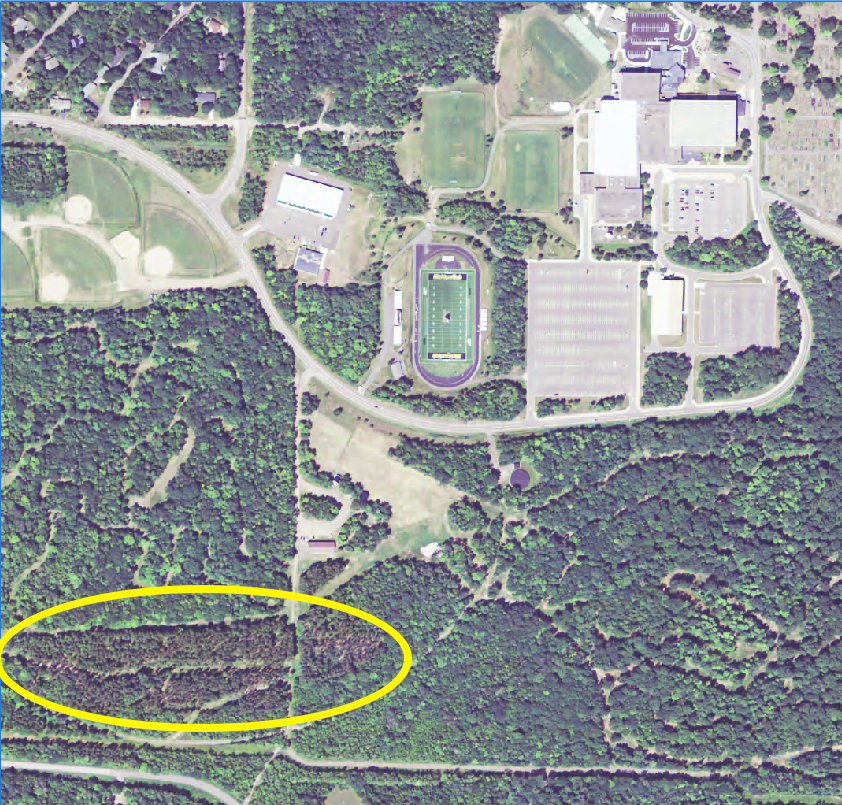
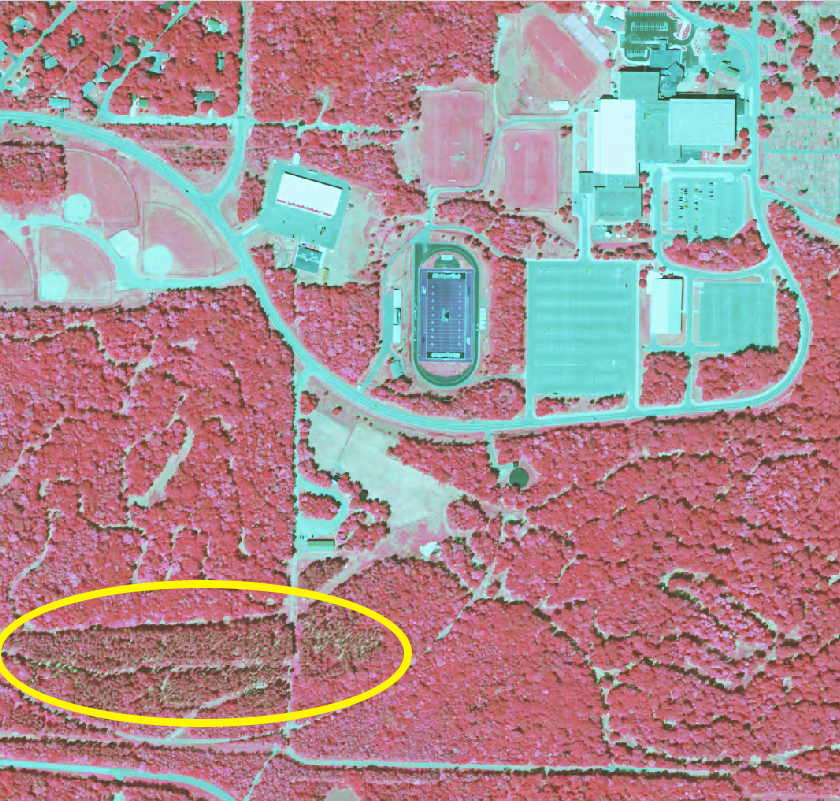
Note that conifers have different leaf cell structure and contain less chlorophyll than deciduous vegetation, so along with differences in texture (conifers often appear coarser), coniferous trees are usually darker on false-color imagery because they reflect less energy in the NIR band. A coniferous stand is highlighted in the two images above.

Citing maps and data

A Twitter conversation this week reminded me that it’s not always easy to cite data or maps you may use in your reports, papers, or theses. As a result, I revisited and updated a web resource I put together 10 or more years ago that lists sample citations for GIS maps and data, and points to other web resources with formatting guides: Citing Geospatial Data Remember, you will need to choose a citation format acceptable to your instructor, advisor, or journal editor.

How to determine the number of streams entering and exiting lakes using NHD data

Obtain data

Download a pre-staged file geodatabase for HUC subregion(s) of interest from http://nhd.usgs.gov/data.html and extract the contents of the download.

Prepare data

In ArcGIS, add the feature classes NHDWaterbodyNHDFlowline, and WBD\HU8 to your map. If you wish to work with lakes and ponds only, either perform a definition query on NHDWaterbodyto show only Type = Lake/pond (“FType” = 390) or select all FType = 390 and write the records out to a new feature class.

Remove the feature type “artificial path” from the feature class NHDFlowline. Artificial paths are created by NHD staff to simulate connections between inflows and outflows from water bodies (rivers entering and leaving lakes). Leaving these features in the data set will result in duplicate entries and an artificially (2x) high number of inflows and outflows. To remove these features from your analysis, you may either select all elements not flagged as ArtificialPath and write out to a new feature class, or perform a definition query to exclude them (“FType” <> 558).

You can create a new file geodatabase to hold your exported files and the results of your analysis or write the new data to the pre-staged geodatabase you downloaded above. Either option is fine.

Perform analysis

Intersect rivers and lakes

Open the Intersect (Analysis) tool and add your two layers (NDHFlowline and NHDWaterbody) as prepared above as Input Features. Change the Output Type (optional) from INPUT to POINT. This tool will create points wherever NHDFlowline features (rivers and streams) enter or exit lakes and ponds. Save your output file with a name that makes sense (e.g., include the HUC ID and InflowOutflow: NHD_403_InflowOutflow).

Add waterbody ID information to your point file

To obtain counts for each lake (total inflows and outflows) each lake will need a unique name. Unfortunately, many NHD lakes are unnamed and lake names are not unique (Examples? search for “Wolf Lake”, “Mud Lake”, or “Deer Lake” in any lakes database). Because of these ‘features’ of the data, generating a unique name isn’t as simple as it might be. A workable suggestion: add a new field to the lakes (NHDWaterbody) attribute table named UniqueName, type of Text and length of 50 characters. Ensure you have no records selected, and use the field calculator to populate the UniqueName field with the expression [GNIS_NAME] & “_’NHD’_” & [OBJECTID]  Replace ‘NHD‘ with the three-digit HUC prefix of the watershed you are working in (Lake Michigan is 403). The output will consist of something like “Wescott Lake_403_7” for records with a lake name, and “_403_17” for records where the lake was unnamed.

Next, perform a spatial join on your InflowOutflow points layer (created in the intersect step above). Right-click on this layer, and choose Joins and Relates > Join. Set the join type to “Join data from another layer based on spatial location” and choose your lakes layer (NHDWaterbody with the UniqueName field added) as the layer to join to your points. Under 2. in the Join Datawindow, set the relationship to is closest to it. (leaving the relationship set to the default it falls inside will result in no results (the points are not in the lakes, but on their borders). Name your output layer as something that makes sense (InflowOutflow_Lake_names) and save it in your file geodatabase.

Summarize results

Open the attribute table of your output file (InflowOutflow_Lake_Names). Find the UniqueName field and sort it (either ascending or descending) and look a the results. You should find multiple instances of many records (lakes with more than one inlet or outlet). All Distance values should be 0.

Right-click on the field UniqueName and choose Summarize. Choose the output destination (your file geodatabase unzipped or created above) and click OK. Answer Yes when prompted to add the summary table to the map. The resulting table will have one record for each lake (as found in UniqueName) and a Count_UniqueName value that summarizes the number of records of each UniqueName in your InflowOutflow_Lake_Names database. This Count value shows the number of streams entering or leaving each lake.

(Optional) Label lakes with Inflow / Outflow counts

As a last step you can join the summary table (created in the last step) to your lakes layer (NHDWaterbody) to label each lake with its total inflows and outflows. This join should be on the common field UniqueName. Be sure to Join attributes from a table, not Join data from another layer based on spatial location.

DNRGPS tutorial – GIS data in Michigan GeoRef to GPS

1) Launch ArcMap and add your data in Michigan GeoRef coordinates to your map.

2) Make ArcToolbox visible and expand Data Management Tools > Projections and Transformations > Feature > and double-click the Project tool to open it. You can also open the Search window (Windows > Search or Ctrl-F) and search for the Project (Data Management) tool.

3) Select the layer you want on your GPS as the Input Dataset and verify that the Input Coordinate System is NAD_1983_Michigan_GeoRef_Meters. Choose the location and name of your output file (maybe adding WGS84 to the end of the file name). Be sure you are saving a shapefile and not a geodatabase feature class. Click the Spatial Reference Properties icon to select the Output Coordinate System. Expand Geographic Coordinate Systems, then World, and select WGS 1984.
Tip: If you right-click on this (or any) projection definition and choose “Add to Favorites” it will be easier to find in the future.

4) Click OK to run the tool. Your re-projected layer will be added to your map after the tool has finished. You can verify your new layer’s projection by opening its properties and examining the Source tab. If all went well, the Projected Coordinate System should read GCS_WGS_1984.

5) Launch DNRGPS. Choose File > Load From > File… and navigate to the shapefile you just saved. Select it and click Open. Verify that the values in Latitude and y_proj are the same, that Longitude and x_proj are the same, and Projection: No Projection is shown at the bottom of the window. If the values are different or a projection name is shown, something was not set properly in a earlier step and DNR GPS is converting projected to unprojected coordinates, perhaps incorrectly…

6) Connect your GPS and turn it on. You should see a message near the top of the window that your GPS now connected. If you don’t, verify the GPS is on, check your cable, and select GPS > Connect to Default GPS. If that fails, try GPS > Find GPS.

7) To transfer your GPS data, select Waypoint > Upload. Your points should appear in the DNR GPS window. (if you loaded a line shapefile into DNR GPS, choose Track > Upload). You should see a status message after the upload is complete.

DNR GPS tutorial – GPS data to Michigan Georef in ArcGIS

1) Launch DNR GPS and ensure the projection is set to None (File > Set Projection and click the Set Projection to NONE button:


2) Connect your GPS and turn it on. You should see a message near the top of the window that your GPS now connected. If you don’t, verify the GPS is on, check your cable, and select GPS > Connect to Default GPS. If that fails, try GPS > Find GPS.

3) To transfer your GPS data, select Waypoint > Download. Your points should appear in the DNR GPS window.

4) To save your GPS data, choose File > Save To > File… and Save as type… text file (comma delimited) (*.txt). Consider this file your ‘backup’ that can be easily opened by DNR GPS without issue. Next, choose File > Save To > File… and Save as type: ESRI Shapefile (*.shp). This file can be manipulated in your GIS software.

5) Launch ArcMap and add the shapefile you just saved in step 4 to your map.

6) Make ArcToolbox visible and expand Data Management Tools > Projections and Transformations > Feature > and double-click the Project tool to open it. You can also open the Search window (Windows > Search or Ctrl-F) and search for the Project (Data Management) tool.

7) Add your shapefile as the Input Dataset and verify that the Input Coordinate System is GCS_WGS_1984. Choose the location and name of your output file (maybe adding MGRF to the end of the file name). Click the Spatial Reference Properties icon to select the Output Coordinate System. Expand Projected Coordinate Systems, then State Systems, and select NAD 1983 Michigan GeoRef (Meters).

Tip: If you right-click on this (or any) projection definition and choose “Add to Favorites” it will be easier to find in the future.

8) Click OK to run the tool. Your re-projected layer will be added to your map after the tool has finished. You can verify its projection by opening the layer’s properties and examining the Source tab. If all went well, the Projected Coordinate System should read NAD_1983_Michigan_GeoRef_Meters.

Tutorial – formatting tabular data for joining to ArcGIS features

Here is a short tutorial that outlines the steps for formatting spreadsheet (tabular) data in preparation for joining it to features (points, lines, or polygons).

If you aren’t familiar with joins, they allow you to attach attribute data that is separate from (external to) your features. In order for joins to work, a common field that contains a unique identifier is needed in both the features and the external data. A join will match records in the external data table to features in the GIS layer based on the values in the unique ID field.

An example of features and data that have this relationship is Census tracts, which change infrequently (features). To the tracts you can join any number of metrics collected or calculated by the Census bureau: residents tabulated by race, income, education; housing stock and attributes (tabular data).

This is a very generic and basic tutorial. Please email with questions or comments.

Using MapTips in ArcGIS

It is often useful in a map to enable “MapTips” for layers in an ArcMap document. When map tips are on, hovering the cursor over a feature on the map will display the contents of a field from the attribute table in a pop-up window. This eliminates the user’s need to use the Identify tool on a layer.

To turn on map tips, open properties for the layer and choose the Display tab. In the Display Expression box, select the field you would like shown in the pop-up and check “Show map tips using the display expression“.

However, you may find this option unavailable (“grayed out”) when trying to enable map tips.

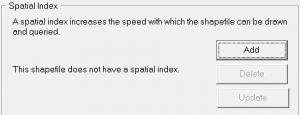
This is usually caused by the layer not having a spatial index available (see this post from ESRI for more information). The solution is to build a spatial index. This may be accomplished two ways:

1) in ArcCatalog, navigate to the layer, select it, and open Properties. Choose the Indexes tab and click Add under Spatial Index.  

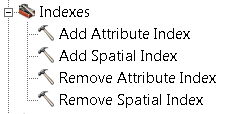
2) use the Add Spatial Index tool. In Arc Toolbox expand Data Management Tools > Indexes  and open the Add Spatial Index tool. Select your layer as the Input Features in the tool and click OK.

An advantage to using the ArcToolbox tool is it may be used to rebuild an existing spatial index. ArcCatalog may only be used to create an index if one does not already exist.

After creating a spatial index, the Show MapTips option should be available for your layer.

Georeferencing scanned images in ArcGIS

Georeferencing is the process of assigning a coordinate system to a scanned image (map, aerial photo) in GIS. A georeferenced image does not have all scale (vertical scale) distortion removed, so if you georeference an air photo with a large amount of vertical relief across the scene, the scale of the image and the accuracy of the alignment will vary across the scene. For scanned maps, the fit should be better, as nearly all maps are planimetric (designed with scale distortions removed).

To georeference a hardcopy map or photo, you will need both a high-quality scan of the original, plus a reference layer. The reference layer can be in any coordinate system, but you should have five points that you can see on both the scanned image and the reference layer. These should be features that are unlikely to move over time, such as road intersections, bedrock outcrops, or street corners.

Once georeferencing has been applied to your scan, you may use it in conjunction with other layers either as a backdrop for a map or as a source from which you can create new features. The quality of the original map or photo, the resolution of the scan, and your ability to locate high-quality control points will all affect how well the georeferenced image will fit with other features in your GIS.

Here is a document that describes the georeferencing process in ArcGIS. The instructions should work for both ArcGIS 9.x and 10.x.