QGIS 2.4 released

QGIS 2.4 (Chugiak) was released recently. QGIS runs on Windows, Macintosh, Linux, and BSD operating systems. It is free, open source (FOSS) software. QGIS is now producing new versions quarterly, so look for the next update in October.

Some highlights:
•QGIS now has multithreaded rendering. The upshot? It’s FAST when your map is redrawing.
•Better python support. QGIS is scriptable via python, and the console and API have been improved over earlier releases.
•There are new analysis functions, updated plugin management, and map composition and labeling tools.

A complete list of what’s new is available here.

If you are interested in using QGIS and would like support, send a message to it-help@mtu.edu to make an appointment with a consultant.

Add Coastal Vignettes to your map

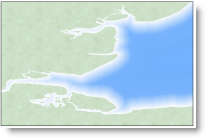
Coastal Vignettes are graphic representations of where land and water meet. Vignettes are symbolized so the land appears to gradually fade into the water, representing shallow areas near shore transitioning into deepening water.

Trees


image source: esri

Not wishing to ‘reinvent the wheel’, here are some postings about the creation of coastal vignettes in ArcGIS from the fine cartographers at Esri:

1) Symbolizing Shorelines   2) Ask a cartographer: coastal vignettes  3) FAQ: What are coastal vignettes and how can I create them? 4) Vector and Raster Methods for Creating Coastal Vignettes (ESRI white paper linked from #3).

These were written for older versions of ArcGIS but are still current…


Keeping ArcGIS up to date

All software is released with some bugs. Software vendors will periodically provide updates, patches, or service packs to fix issues identified with their software, and Esri is no exception. Discovering what fixes are available, as well as finding the correct updaters on their web site, can be a bit tricky. Below you will find some tips to help a) navigate their support site, and b) decide if you need to install the updates you find.

First, visit support.esri.com. This page has links to esri’s knowledge base and support forums, as well as their downloads. Look for “Patches and Service Packs” at the top of the Downloads list.

The list that appears may be somewhat is overwhelming, as it includes more than 80 products–some legacy, and some that have been renamed over time. The trick is to find the correct product in the list and drill down from there. With a product list whose names have transmogrified in recent years, this is no mean feat.

The esri software that most of us use is ArcGIS, named in the resulting list as as ArcGIS for Desktop. (Please note that if you have any extensions installed, they may be listed separately. You should occasionally check for updates to extensions you use often).

Once in the list of Patches and Service Packs for ArcGIS for Desktop, a browse filter is available on the right side of the page. 
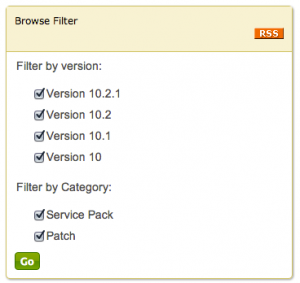
In the browse filter you may deselect the versions of ArcGIS that you don’t use. Clicking the Go button will shorten the list of available updates to include only those for your installed version. The installers will be presented from newest to oldest. It’s still a long list, but is less cluttered and pertinent to your ‘flavor’ of ArcGIS.

Some tips for parsing this list:

• reading the summary for the update will help you decide if you should install it (these are provided on the list page). For example, if you never work with parcel data or imagery in format X, you probably don’t need to download and install patches to fix issues with those data types.

• If you identify patches you think you need to download and install, read the description page for more information. The top of each description page will contain the summary shown in the list (described above) plus hyperlinks to more extensive information, including a detailed description of the patch, what it fixes, who should install it, what it installs, where to download the patch, and how to determine what updates you have already installed.
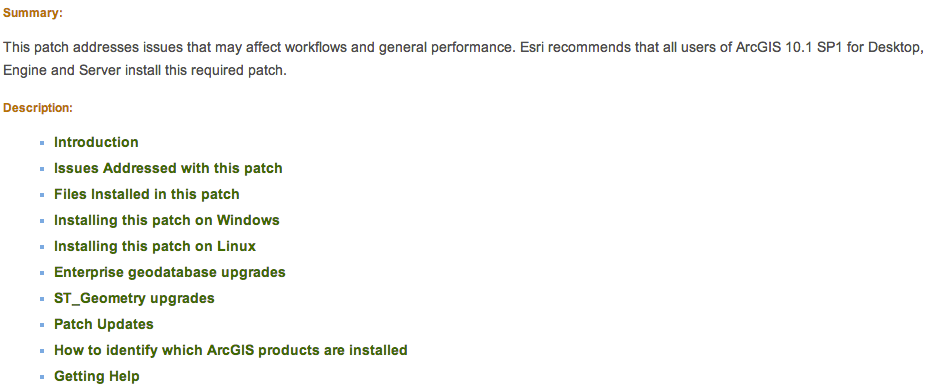
• you probably should install any service packs or ‘quality improvement’ updates. The web page that describes the release will contain a link to ‘issues addressed’ by the software patch. SP1 for ArcGIS 10.1 purportedly fixed over 500 bugs, and the recent QIP release for 10.1 lists over 250 fixes. Wow.

• a service pack will contain all prior patches and updates, so anything older than the service pack doesn’t need to be installed first.

If you have identified updates you need, are a Michigan Tech employee or student, and don’t have administrative access on your office computer, send an email to it-help to request that the patch be installed. Please be specific, with a link to the installer, as well as your computer hostname.

If you have any questions, please contact me directly.

R.I.P. Dr. Roger Tomlinson

Dr. Roger Tomlinson, the ‘Father of GIS’, passed away on February 9, 2014.

Visit GISLounge for a brief news release and The Globe and Mail for a summary of his accomplishments.

A video showing the first true GIS is available on YouTube, and a helpful web citizen posted a link to a PDF of the first GIS meeting proceedings – from 1970!

Finally, Esri Canada (eh?) has put together a tribute to Dr. Tomlinson.

ESRI releases new toolbox

ESRI has released an update to the Spatial Analyst Supplemental Toolbox, bringing the version to 1.3. It adds new tools for zonal statistics and tabulate areas functions, and new options for watershed analysis (he determination of maximum upstream elevation).

An overview and details are available at the ArcGIS Resources blog. A direct download link to the toolbox is http://esriurl.com/SpatialAnalystSupplementalTools  and a complete discussion of the tools in the toolbox is at Introducing the Spatial Analyst Supplemental tools

Please note that ArcGIS 10.1 SP1 or later is recommended.


Happy GIS Day!

GIS Day is always celebrated on Wednesday during Geography Awareness Week (the third week of November), and this year it’s today, November 20. For some of us, GIS Day is every day, because we use the technology all the time. For everyone else, the reminder is good, because Geospatial technology is everywhere these days: on our phones and tablets, our computers, and even in the news. Not everyone is aware of its pervasiveness, reach, and possible uses, but every bit of press helps.

The interactive maps you see in news reports often have a GIS operating in the background, whether it’s ArcGIS Online, Google Maps, MapBox, TileMill, or ‘other’ (sorry if I left your favorite technology off this list – it’s not meant to be exhaustive). A cool recent example of one of these ‘story maps’ may be found at the Wall Street Journal web site, and deals with nuclear waste cleanup.

Enjoy!


Student version of ArcGIS (10.1 and 10.2)

ArcGIS 10.2 was recently released. This has changed the method for activating a student edition of ArcGIS 10.1

http://www.esri.com/apps/Products/ArcGIS/ArcEdEval10/index.cfm?event=evaluate.index

Use the link above to pre-register your activation code for ArcGIS 10.1. If you use the link http://www.esri.com/StudentEdition you will see an error (error code 7174) during the activation process.

I should have codes valid for ArcGIS 10.2 in the very near future. Look for further updates here if you are interested.

Tips for working with large data sets

I was at the Esri user conference a few weeks ago and am still working through my notes, so be prepared for a number of future ‘news’ posts regarding Esri products.

ArcGIS has been able to use 64-bit processing in the background since the release of Service Pack 1 for 10.1. A post from an Esri support person (dated last year) outlines some ways you can plan for working successfully with large data sets in ArcGIS.

The good news on the large data set front is: ArcGIS Professional is due to be released “in the near future”. It features multithreaded processing, i.e. if you have a 4- or 8-core processor, more than one core can be used to help your jobs finish faster. It will also be a true 64-bit application; will have integrated 2- and 3-D viewing capabilities; includes new editing capabilities; will bring back multiple layouts in a project (which we lost after ArcView 3.x); and has a number of other new capabilities that looked awesome in the demonstration. (However, demos in front of 13,000 people are very highly scripted, so I’ll withhold final judgement until it is released or I can play with a beta version). ArcGIS is finally going to 11.


Using the buffer wizard in ArcGIS 10.x

A complete PDF version of this post is available here

The Buffer Wizard is a ‘hidden’ add-on to ArcGIS. It allows for additional control when creating buffers. Specifically, it makes creating ‘inside’ buffers easier than the standard buffer tool.

The wizard was removed from the standard ArcMap user interface after ArcGIS 8.3, but is still available if you customize the user interface. I covered adding the buffer wizard in an earlier post (https://www.gis.mtu.edu/?p=448), but a quick summary of the steps is to open the Customize menu and choose Customize mode… Select the Commands tab, then enter the text ‘buffer wizard’ in the ‘Show commands containing’ box. Drag the tool to a toolbar (the Tools toolbar is suggested).

One possible application for this tool would be in preparation to perform sampling. You might want to assess the understory vegetation in a plot of land, but don’t want any of your sampling point to be within 10 meters of the edges of the plot.

1. Click the Buffer Wizard icon to start the tool

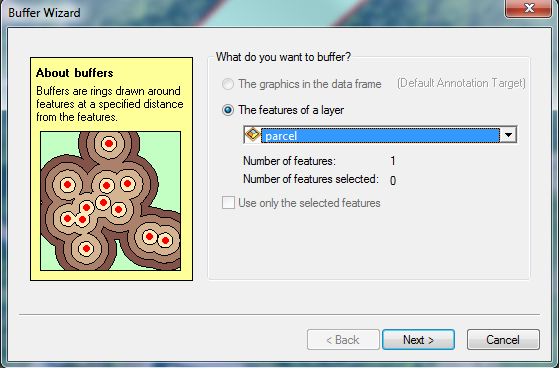
2. Choose the polygon layer that represents the area you want to sample from the drop-down list and click Next>.

3. Specify your buffer distance (10) and verify the units are correct (meters). Note that you could choose to buffer based on an attribute table value or create multiple ring buffers here. Click Next>.

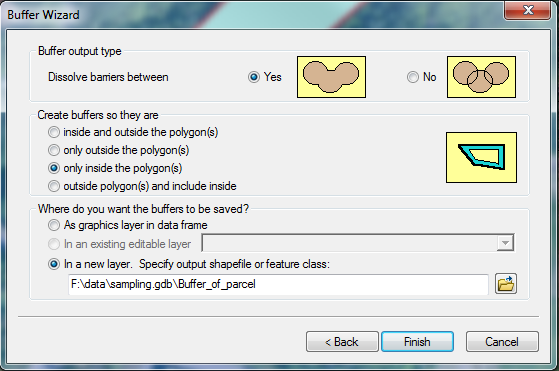
4. In the next window, select “only inside the polygons” and choose an output filename. This can be either a shapefile or a feature class in a geodatabase. Finish>.

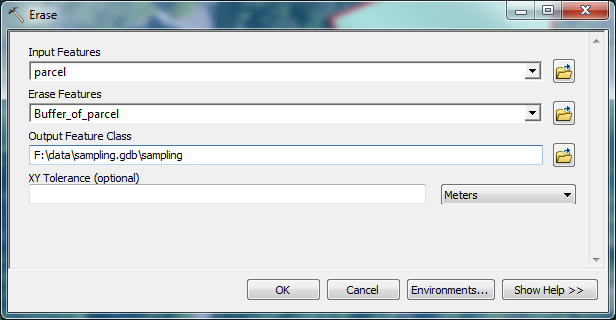
To remove areas within 10 meters of the boundary of your parcel, you will need to perform one additional step with the Erase tool. You can either use the Search tool (Windows > Search or Cmd-F) or expand ArcToolbox > Analysis Tools > Overlay > Erase. Your Input Features should be your Parcel layer, and the Erase Features your inside buffer. Choose an output file and click OK.

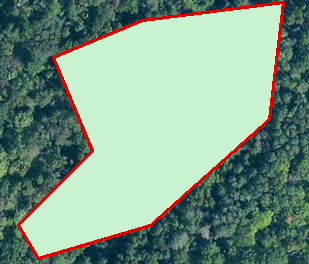
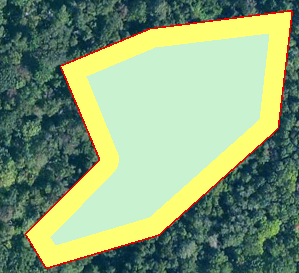
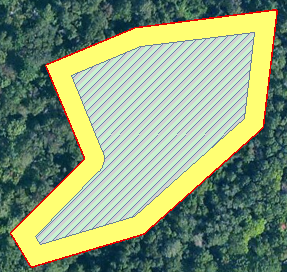
Here is how the original parcel appears, followed by the inside buffer and resulting polygon with the 10-meter border erased:


Original parcel (green with red border)


Inside buffer (yellow)


Final sampling area (crosshatched area)

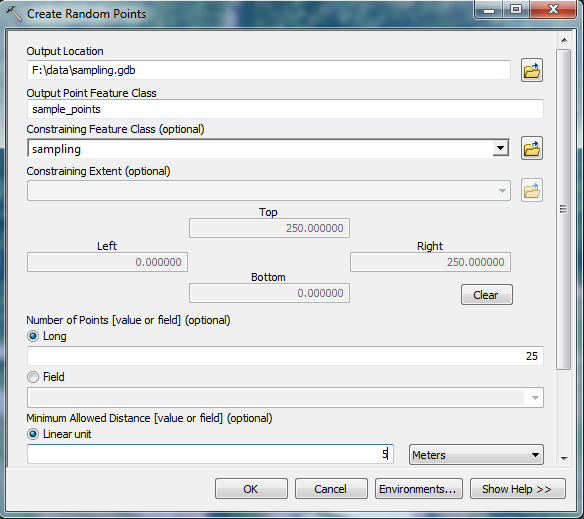
Now if you generate random sampling points using ArcToolbox > Data Management Tools > Feature Class > Create Random Points, you can use the final sampling area as a constraining feature class and ensure none of your points will be within 10 meters of the parcel boundary.

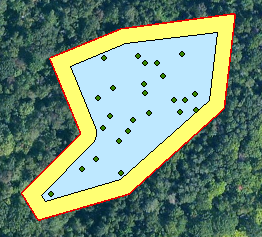
The resulting points are shown here:
Note that none fall within the 10-meter buffer.

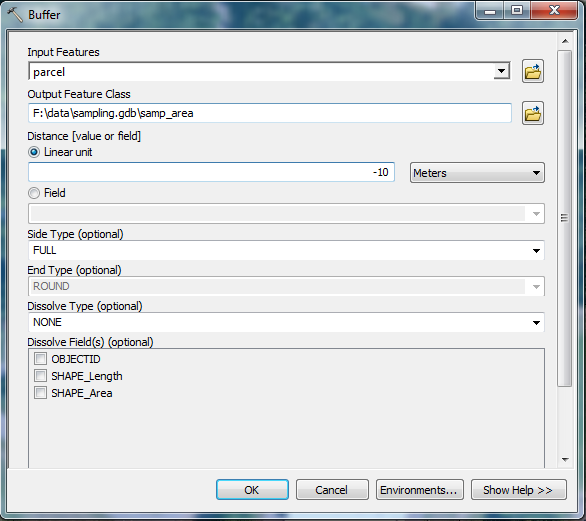
There is nearly always more than one way to accomplish a task in GIS. This workflow was written to illustrate the creation of an inside buffer using the Buffer Wizard, and a possible application with an inside buffer. The standard ArcGIS Buffer tool (ArcToolbox > Analysis Tools > Proximity > Buffer) lets you enter negative buffer distance values.

The resulting polygon has the same geometry as the original, just shrunk by the negative buffer amount (in the example above, 10 meters). It creates the same final polygon as the buffer inside then erase workflow above (buffer shown in blue below) with just a single step… You may have other needs for an inside buffer, though, so the Buffer Wizard can be quite useful.