ArcGIS Pro crashing when editing symbology

This bug was introduced when Microsoft made some changes to their dotNet libraries back in November. The fix? Install a patch to the latest version of ArcGIS Pro 2.8 or 2.9. Links are below. You will need to be logged in to Google with your Michigan Tech credentials to download the patches.

Patch for ArcGIS Pro 2.8

Patch for ArcGIS Pro 2.9

ArcGIS Pro version 3.0 and up is not affected by this bug as it uses a newer version of dotNet…

Watershed modeling (Flow Direction) in ArcGIS Pro

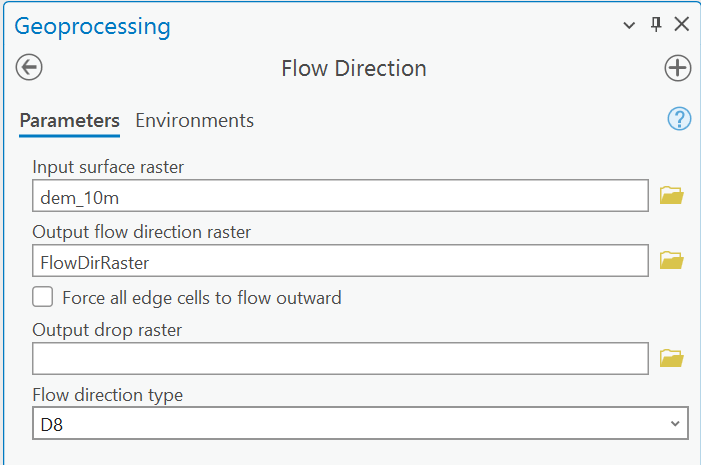
You may run into issues when trying to run the Flow Direction tool in recent versions of ArcGIS Pro. This usually is evident as the tool taking an unusually long (infinite) amount of time to run to completion. A workaround that we have identified is as follows:

Make your selections as you normally would in the tool under the Parameters tab.

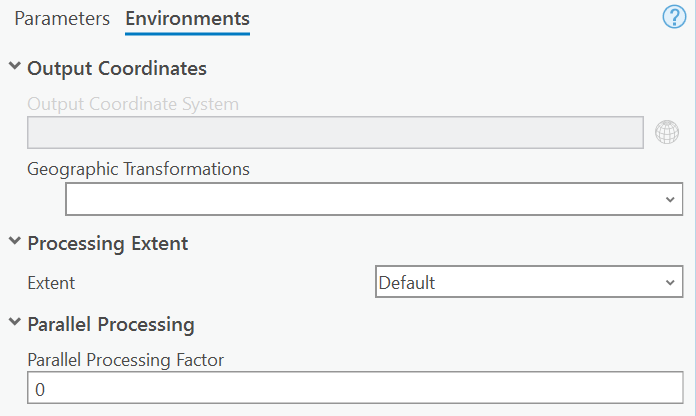
Next, switch to the Environments tab in the Flow Direction tool. Enter 0 under the Parallel Processing Factor option.

Click Run. The tool should run in a normal amount of time.

Calculating stream sinuosity (in esri products)

A river’s sinuosity is its tendency to meander back and forth across its floodplain, in an S-shaped pattern, over time. As the stream moves across the landscape, it may leave behind evidence of where the river channel once was (these can take the form of meander scars or oxbow lakes). These patterns usually appear in stream channels found in softer sediments. If a river’s course is bedrock-controlled, other factors—primarily rock strength and structure—control the river’s flow. Few stream courses are completely straight, and most exhibit meanders.

If you ever work with hydrologic data in GIS, you may wish to determine the sinuosity for an entire river or a particular ‘reach‘ of a river of interest. A stream that doesn’t meander at all has a sinuosity of 1. The more meanders in a stream, the closer the sinuosity value will get to 0. Fortunately, it’s simple to determine the sinuosity of a line using either the field calculator or Python. Depending on the version of GIS software you are using, the method differs. See this post for details for ArcView 3 (old!) and ArcMap 8.x-10.2.

Citing maps and data

A Twitter conversation this week reminded me that it’s not always easy to cite data or maps you may use in your reports, papers, or theses. As a result, I revisited and updated a web resource I put together 10 or more years ago that lists sample citations for GIS maps and data, and points to other web resources with formatting guides: Citing Geospatial Data Remember, you will need to choose a citation format acceptable to your instructor, advisor, or journal editor.

QGIS 2.4 released

QGIS 2.4 (Chugiak) was released recently. QGIS runs on Windows, Macintosh, Linux, and BSD operating systems. It is free, open source (FOSS) software. QGIS is now producing new versions quarterly, so look for the next update in October.

Some highlights:
•QGIS now has multithreaded rendering. The upshot? It’s FAST when your map is redrawing.
•Better python support. QGIS is scriptable via python, and the console and API have been improved over earlier releases.
•There are new analysis functions, updated plugin management, and map composition and labeling tools.

A complete list of what’s new is available here.

If you are interested in using QGIS and would like support, send a message to it-help@mtu.edu to make an appointment with a consultant.

Tutorial – formatting tabular data for joining to ArcGIS features

Here is a short tutorial that outlines the steps for formatting spreadsheet (tabular) data in preparation for joining it to features (points, lines, or polygons).

If you aren’t familiar with joins, they allow you to attach attribute data that is separate from (external to) your features. In order for joins to work, a common field that contains a unique identifier is needed in both the features and the external data. A join will match records in the external data table to features in the GIS layer based on the values in the unique ID field.

An example of features and data that have this relationship is Census tracts, which change infrequently (features). To the tracts you can join any number of metrics collected or calculated by the Census bureau: residents tabulated by race, income, education; housing stock and attributes (tabular data).

This is a very generic and basic tutorial. Please email with questions or comments.