Georeferencing scanned images in ArcGIS

Georeferencing is the process of assigning a coordinate system to a scanned image (map, aerial photo) in GIS. A georeferenced image does not have all scale (vertical scale) distortion removed, so if you georeference an air photo with a large amount of vertical relief across the scene, the scale of the image and the accuracy of the alignment will vary across the scene. For scanned maps, the fit should be better, as nearly all maps are planimetric (designed with scale distortions removed).

To georeference a hardcopy map or photo, you will need both a high-quality scan of the original, plus a reference layer. The reference layer can be in any coordinate system, but you should have five points that you can see on both the scanned image and the reference layer. These should be features that are unlikely to move over time, such as road intersections, bedrock outcrops, or street corners.

Once georeferencing has been applied to your scan, you may use it in conjunction with other layers either as a backdrop for a map or as a source from which you can create new features. The quality of the original map or photo, the resolution of the scan, and your ability to locate high-quality control points will all affect how well the georeferenced image will fit with other features in your GIS.

Here is a document that describes the georeferencing process in ArcGIS. The instructions should work for both ArcGIS 9.x and 10.x.

Store relative pathnames for layers in ArcGIS

By default in ArcGIS 10, full pathnames are stored for all layers you add to a map. This means if you have a file located at c:\data\hydro\rivers.shp that’s used in a map, the full pathname (c:\data\hydro\rivers.shp) to the layer is stored in the map document. ArcMap will always look in c:\data\hydro for the file rivers.shp. Using relative pathnames allows you to move map documents and layers around, as long as the relative locations of the map document and the data don’t change, e.g., as long as the map.mxd map document and the folder data (containing a subfolder hydro with the file rivers.shp, shown below) are moved together, ArcMap will still be able to open the map without issues.

To make the change to relative paths for a single map, choose Map Document Properties… from the File menu and check Store relative pathnames to data sources.

If you want all your new maps to be stored with relative paths you will need to specify relative paths as the default. To do so, click Customize > ArcMap Options… to open the ArcMap Options dialog box, and then click the General tab. Check the option to Make relative paths the default for new map documents. This setting is stored in the registry.

Why should you care about these settings? If you move map documents and data around, say on a flash drive or portable hard drive, these devices can be assigned different drive letters (e, f, g, i…) depending on what computer they are plugged into. If the drive letter changes between sessions and you are using full path names, ArcMap will be unable to find some, or all, layers in your map, and you will be presented with an exclamation point next to the ‘missing’ layers:

 Speaking from personal experience, it is a pain to have to re-connect more than a few missing layers, and some maps have dozens. What’s the process to fix a missing layer?

  • Open the layer’s properties, either by double-clicking on the layer name or right-clicking on the layer and choosing Properties…
  • Click the Source tab and then the Set Data Source… button, browse to the layer’s location on your computer, select it, click add, then OK.
  • Repeat for each missing layer.

To avoid having to repair any map documents in this fashion, you should either a) never move your map documents and associated files around, or b) use relative pathnames, and store your map documents and data in the same directory (or subdirectories).

Google Earth blog

A great source to find news, new data, and interesting features to explore in Google Earth is the Google Earth blog. If you’re more interested in “odd” things found in GE, try map of strange (not affiliated with Google).

While I’m on the topic of odd, check out Strange Maps, a blog showcasing some unusual print maps, including “US States renamed for countries with similar GDPs“. Those who aren’t used to the ‘rustic’ nature of much of the Upper Peninsula might enjoy the “Map of the area surrounding our holiday home“.

Importing x,y data into ArcGIS

Importing a set of x,y coordinate pairs into ArcGIS is very straightforward, and can be a useful skill if you need to bring in simple coordinate data that is not already in a spatial format.

1) Acquire some data you want to display on a map. The source doesn’t matter: it might be locations recorded on a GPS unit that you don’t have a data cable for, coordinates determined from a topographic map, or a simple data set found on the internet. If you want your locations to integrate correctly with other layers (always a good thing in GIS) you will need to know both the coordinate system and datum used by the source data, e.g. latitude / longitude and NAD27.

2) Format your data properly. This may be done in a spreadsheet program such as Google Spreadsheets <spreadsheets.google.com>, or the more ubiquitous Excel. To import properly into ArcGIS, your data file will require a minimum of three fields: a unique identifier for each data point, and the X (easting) and Y (northing) for each location. Other attribute data, if available, may go into additional columns, but your points will import fine with just these three pieces of information. Your file should also contain a header line that describes each field. It might be as simple as ID, X_coord, Y_coord. Additional fields are OK, but descriptions in each header are limited to seven characters and cannot have special characters or spaces. If you need spacing for readability, use underscores.

Be sure if you are using latitude/longitude coordinates that your northings are positive if north of the equator and eastings are negative if you are in the western hemisphere. Example: the coordinates for a location in Houghton, Michigan are -88.54820, 47.11535 in latitude/longitude and 382552, 5219145 in UTM zone 16, NAD 1983 datum. Omitting the “-” sign will put your points on the wrong side of the globe.

If your coordinates are in latitude/longitude, they should be in decimal degrees (DD) format before importing into ArcGIS. Locations in degrees, minutes and seconds (DMS) or decimal minutes (DM) format should first be converted to DD. There are converters available on the internet, but it is probably quicker to use Excel to perform the conversion.

D = Degrees  M = Minutes  S = Seconds  .m = Decimal Minutes  .s = Decimal Seconds

DM.m = Degrees, Minutes, Decimal Minutes (eg. 45°22.6333)
D.d = Degrees, Decimal Degrees (eg. 45.3772°)
DMS = Degrees, Minutes, Seconds (eg. 45°22’38”)

DMS –> DM.m (45°22’38” –> 45°22.6333)
◦ Divide S by 60 to get .m (38/60=.6333)
◦ Add .m to M to get M.m (22+.6333=22.6333)

DM.m –> D.d (45° 22.6333 –> 45.3772)
◦ Divide M.m by 60 to get .d (22.6333/60=.3772)
◦ Add .d to D to get D.d (45+.3772=45.3772)

D.d –> DM.m (45.3772 –> 45°22.6333
◦ Multiply .d by 60 to get M.m (.3772*60=22.6333)

DM.m –> DMS (45°22.6333 –> 45°22’38”)
◦ Multiply .m by 60 to get S(.6333*60=38)

DMS–>DD
◦ D + M/60 + S/3600 = DD

3) Save/export your data as a comma-delimited text file (CSV format in Google Spreadsheets or Excel). You may want to save a copy in native format (.xls in both Google spreadsheets and Excel) before exporting to .csv.

4) Add your .csv file to ArcMap by using the Add data tool (either by expanding the submenu under File> Add Data)   or by clicking the Add Data tool on the Standard toolbar 
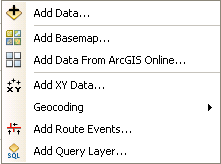
5) Right-click on your new layer and choose Display XY Data… Ensure that the X and Y fields were selected correctly by ArcMap – they should be right if you chose names that reflect the coordinate positions (northing and easting or x and y). Click the Edit… button, then Select… to select the coordinate system for your points, Add… and OK (3x). The correct coordinate system to use may be obtained from your GPS unit (under map setup or units); from the marginal information on your topo map; or from the metadata file that came with internet data. Look in geographic coordinate systems for latitude/longitude projection files, or in projected coordinate systems > UTM for UTM data.

Some possible suggestions:

  • Coordinate Systems > Geographic Coordinate Systems > World > WGS1984.prj  (default GPS datum)
  • Coordinate Systems > Geographic Coordinate Systems > North America > NAD1983.prj  (current North American datum)
  • Coordinate Systems > Projected Coordinate Systems > UTM > NAD1983 > NAD 1983 UTM Zone 16N.prj  (appropriate for most of the U.P.)
  • Coordinate Systems > Projected Coordinate Systems > State Systems > NAD 1983 Michigan GeoRef (Meters).prj  (projection and datum used by the State of Michigan)

6) You should now have a point layer at the top of your Table of Contents with the same name as your .csv file and the word Events on the end of the name.

event layer

This is an “event theme” and is a temporary layer. If you want a more permanent copy, right-click on the layer and choose Data > Export Data… Pick an output location—a geodatabase feature class or a directory for a shapefile—and enter a file name. Please change the name to something other than the default Export_Output – I suggest one that more accurately reflects the contents of the data layer. Click OK.

You now have a permanent layer, either a geodatabase feature class or shapefile, of your original ASCII (text) coordinates.

GIS with Open Street Map and R

I may occasionally publish links to ‘how-to’ posts from elsewhere. I recently came across the information linked below.

OpenStreetMap is a free, editable world map (spatial database). Data from the project may be used in GIS software or uploaded to a map-capable GPS unit.

The R Project for Statistical Computing is the home of R (aka Gnu S) — a free, open source statistics package that has gained a substantial following in recent years. R is multiplatform and has a large, active developer base. There are many example scripts and a copious amount of tutorial information available online to help you learn R.

The blog post found here is entitled Visualizing GIS data with R and Open Street Map. The tutorial uses free software and data for mapping. Enjoy.