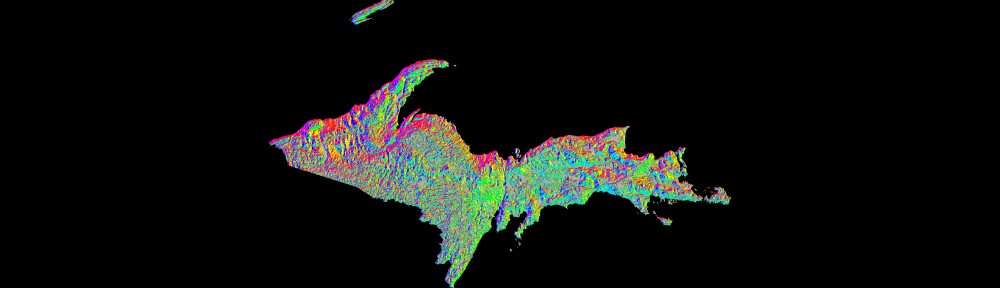
A new look at the election map

Many of you have probably seen one form or another of the U.S. election results maps in the last decade, showing red vs. blue states (or counties), with areas won by the republican candidate shaded in red and those by the democratic candidate in blue.

State by state U.S. Presidential election results, 2012
Source: http://www-personal.umich.edu/~mejn/election/2012/

It’s easy to be ‘misled’ by a map, however, in this case because the colors are applied to states that have very different characteristics (area, total population, population density, and population distribution). The red – vs – blue areas appear to be about equal (and it was a close election) but the map is not as factual as it could be. Is it more accurate to show results on a county by county basis?

County-level results for the 2012 U.S. Presidential election
Source: http://www-personal.umich.edu/~mejn/election/2012/

On this map, the red areas vastly outnumber the blue, giving the appearance of a republican victory. Clearly, looking at the results using counties instead of states does not produce a more accurate map. What’s missing? Population density.

Election results mediated by population density

Election results mediated by population density.
Source: http://www.theatlanticcities.com/politics/2012/11/political-map-weve-been-waiting/3908/

In the above map, the darkness of each color indicates how densely populated a county is. The vast areas of the Great Plains are very sparsely populated, appearing almost white in some parts, whereas the urban centers on the west and east coasts (look at Long Island), as well as in the Great Lakes, have much higher populations and are therefore very dark.

If you are interested in seeing more examples of these maps, I suggest you explore the article showcasing the population density map at The Atlantic Cities, Mark Newman’s election web site (U of Michigan), or Robert Vanderbei’s maps of the 2012 election (Princeton). At these sites you will find cartograms, county maps shaded to show voter split (purples where the vote was close to 50-50), animations, and more.

NPS launches Park Tiles, an NPS basemap

http://www.nps.gov/npmap/blog/introducing-park-tiles.html

“Park Tiles is not meant to be a total replacement for any of the basemaps we currently use. It is, rather, meant to give us an alternative basemap we can use in custom projects where we’d like to see our National Parks highlighted. We’d also like to incorporate more detailed park information (such as campsites, visitor centers, trails, etc.) at larger scales that can serve both NPS employees and visitors.”

First found on Spatially Adjusted

URISA student competition

The Urban and Regional Information Systems Association, URISA, is again hosting its annual student paper and poster competition:

“URISA hosts an annual Student Competition to encourage students in a variety of academic settings and disciplines to write and publish papers and posters to share with the URISA membership and others in the geospatial technologies industry. The submission may include research projects, case studies, projects, or any type of methodology in which geospatial technology and skills were used or could be used.”

See http://www.urisa.org/student_competition for more information. The submission deadline is June 3, 2013.

How to determine the number of streams entering and exiting lakes using NHD data

Obtain data

Download a pre-staged file geodatabase for HUC subregion(s) of interest from http://nhd.usgs.gov/data.html and extract the contents of the download.

Prepare data

In ArcGIS, add the feature classes NHDWaterbodyNHDFlowline, and WBD\HU8 to your map. If you wish to work with lakes and ponds only, either perform a definition query on NHDWaterbodyto show only Type = Lake/pond (“FType” = 390) or select all FType = 390 and write the records out to a new feature class.

Remove the feature type “artificial path” from the feature class NHDFlowline. Artificial paths are created by NHD staff to simulate connections between inflows and outflows from water bodies (rivers entering and leaving lakes). Leaving these features in the data set will result in duplicate entries and an artificially (2x) high number of inflows and outflows. To remove these features from your analysis, you may either select all elements not flagged as ArtificialPath and write out to a new feature class, or perform a definition query to exclude them (“FType” <> 558).

You can create a new file geodatabase to hold your exported files and the results of your analysis or write the new data to the pre-staged geodatabase you downloaded above. Either option is fine.

Perform analysis

Intersect rivers and lakes

Open the Intersect (Analysis) tool and add your two layers (NDHFlowline and NHDWaterbody) as prepared above as Input Features. Change the Output Type (optional) from INPUT to POINT. This tool will create points wherever NHDFlowline features (rivers and streams) enter or exit lakes and ponds. Save your output file with a name that makes sense (e.g., include the HUC ID and InflowOutflow: NHD_403_InflowOutflow).

Add waterbody ID information to your point file

To obtain counts for each lake (total inflows and outflows) each lake will need a unique name. Unfortunately, many NHD lakes are unnamed and lake names are not unique (Examples? search for “Wolf Lake”, “Mud Lake”, or “Deer Lake” in any lakes database). Because of these ‘features’ of the data, generating a unique name isn’t as simple as it might be. A workable suggestion: add a new field to the lakes (NHDWaterbody) attribute table named UniqueName, type of Text and length of 50 characters. Ensure you have no records selected, and use the field calculator to populate the UniqueName field with the expression [GNIS_NAME] & “_’NHD’_” & [OBJECTID]  Replace ‘NHD‘ with the three-digit HUC prefix of the watershed you are working in (Lake Michigan is 403). The output will consist of something like “Wescott Lake_403_7” for records with a lake name, and “_403_17” for records where the lake was unnamed.

Next, perform a spatial join on your InflowOutflow points layer (created in the intersect step above). Right-click on this layer, and choose Joins and Relates > Join. Set the join type to “Join data from another layer based on spatial location” and choose your lakes layer (NHDWaterbody with the UniqueName field added) as the layer to join to your points. Under 2. in the Join Datawindow, set the relationship to is closest to it. (leaving the relationship set to the default it falls inside will result in no results (the points are not in the lakes, but on their borders). Name your output layer as something that makes sense (InflowOutflow_Lake_names) and save it in your file geodatabase.

Summarize results

Open the attribute table of your output file (InflowOutflow_Lake_Names). Find the UniqueName field and sort it (either ascending or descending) and look a the results. You should find multiple instances of many records (lakes with more than one inlet or outlet). All Distance values should be 0.

Right-click on the field UniqueName and choose Summarize. Choose the output destination (your file geodatabase unzipped or created above) and click OK. Answer Yes when prompted to add the summary table to the map. The resulting table will have one record for each lake (as found in UniqueName) and a Count_UniqueName value that summarizes the number of records of each UniqueName in your InflowOutflow_Lake_Names database. This Count value shows the number of streams entering or leaving each lake.

(Optional) Label lakes with Inflow / Outflow counts

As a last step you can join the summary table (created in the last step) to your lakes layer (NHDWaterbody) to label each lake with its total inflows and outflows. This join should be on the common field UniqueName. Be sure to Join attributes from a table, not Join data from another layer based on spatial location.

Important ArcGIS 10.1 updates

Greetings,

ESRI released Service Pack 1 for ArcGIS 10.1 in late October. This service pack fixes several hundred bugs, and includes other interesting functionality (mainly the release of 64-bit background geoprocessing, allowing for the use of > 4GB of RAM!).

To find current patches and service packs for 10.1, go to http://support.esri.com/ and choose the link Patches and Service Packs under Downloads. Choose ArcGIS for Desktop from the list. Under the Browse Filter, uncheck Version 10 and click Go. Only updates for ArcGIS 10.1 will be listed.

Important patches to apply:

ArcGIS 10.1 Service Pack 1 for (Desktop, Engine, Server)

ArcGIS 10.1 SP1 for Desktop Background Geoprocessing (64-bit) (found under the Product section ArcGIS 10.1 SP1 for Desktop. This product must be installed AFTER SP 1 is installed)

ArcGIS 10.1 SP1 (Desktop, Engine, Server) Mosaic Dataset/Image services reprojection Patch (install after Service Pack 1)

Please note if you have other software installed (ArcGIS for Server or the optional software add-ons Data Reviewer or Workflow Manager) there are separate updaters for these products.

If you are unsure what you have installed, search for PatchFinder for Windows on the SP 1 download page. This software (a tiny ~700 kb download) will report what ESRI products have been installed on your computer.